
 Jump Back

Headline
The Q1 2026 data point is the most meaningful single quarter move on the curve since 2022, and the first clear signal that Ireland’s private/professional labour market has shifted out of the post-COVID “tight but cooling” phase and into something genuinely looser. Unemployment ticked up to 4.2% (from 3.6% in Q4 2025) while vacancies dipped to 1.01% – the lowest level since the 2020/2021 COVID period and below where vacancies have sat throughout 2024–25.
One quarter doesn’t make a trend, and CSO data this quarter is unusually noisy (more on that below). But the direction is clear and consistent with what we’re seeing across the market.
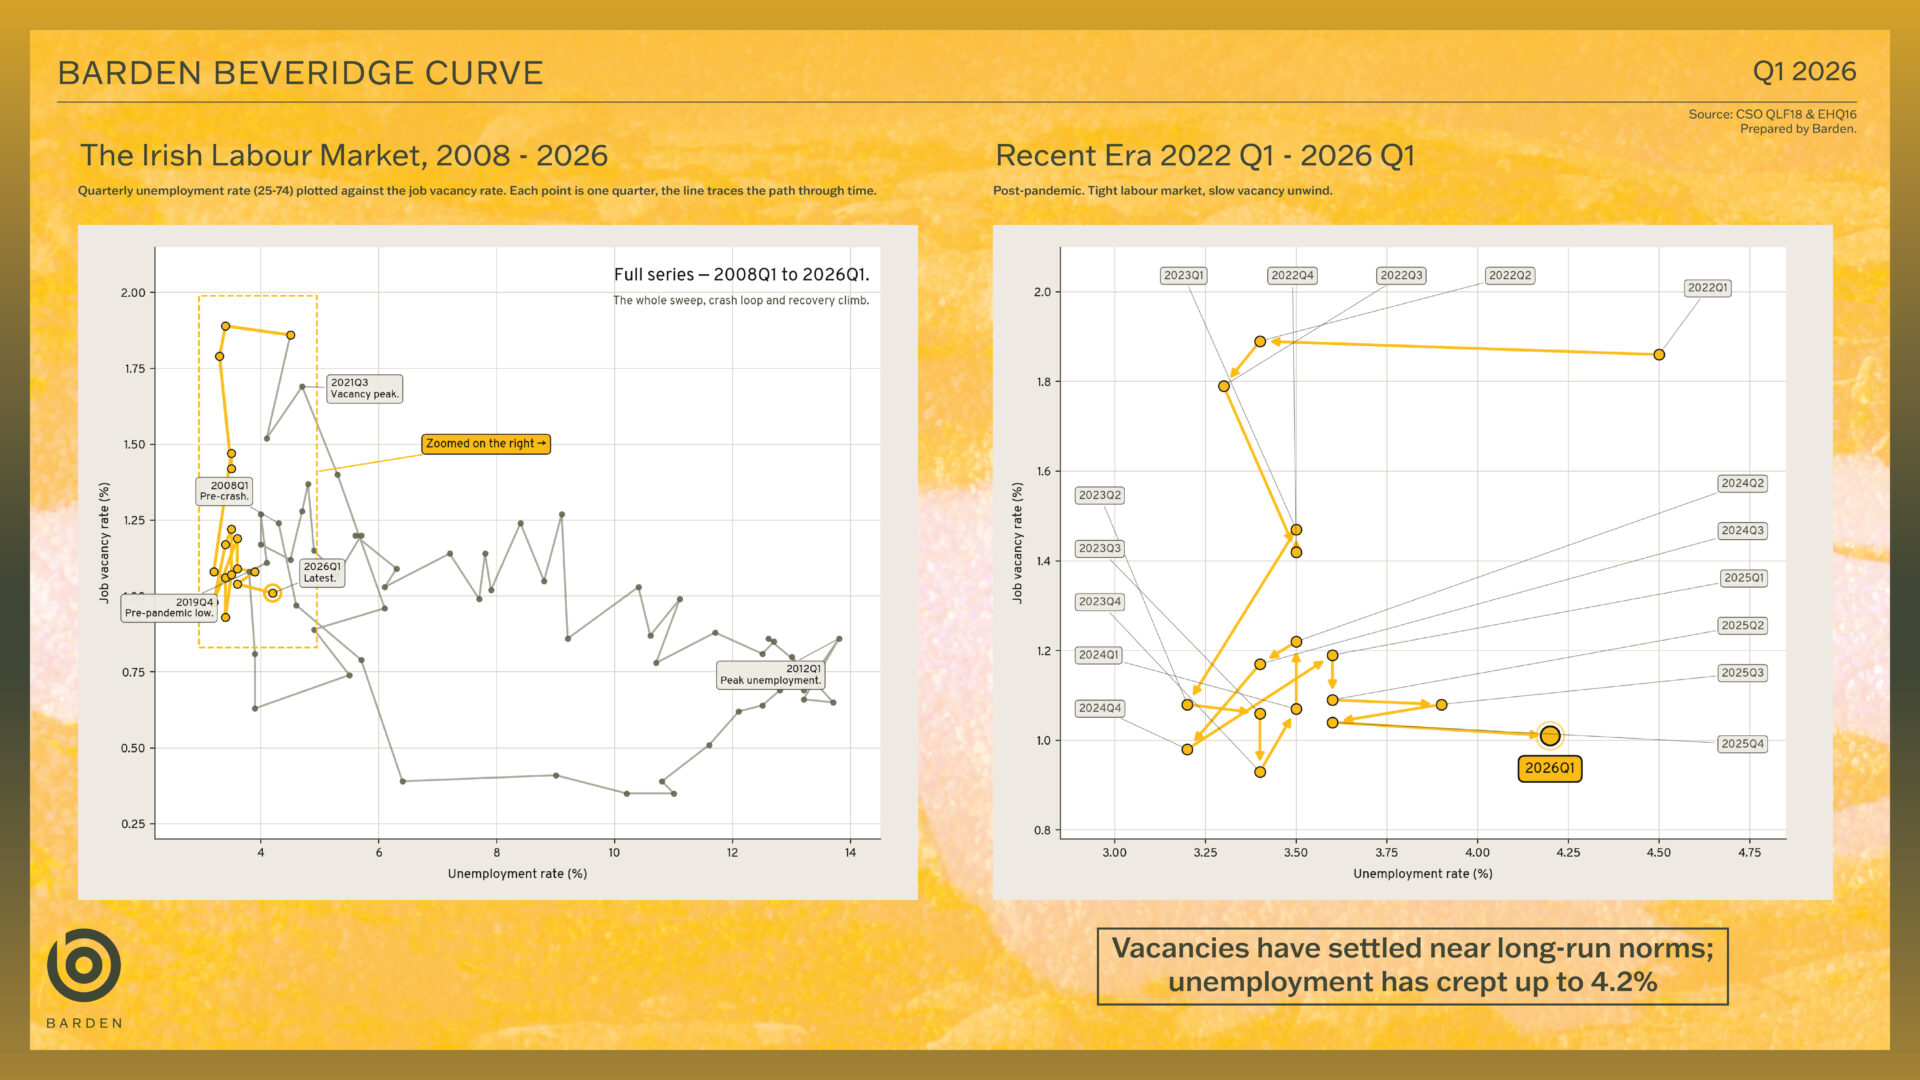 Period covered: 2008Q1 – 2026Q1. Private/professional sector (excludes public sector and related entities such as universities).
What the Curve is Telling us
A Beveridge curve plots unemployment against vacancies. It moves along itself with the business cycle (recession pushes points bottom-right, recovery pulls them top-left) and shifts when the matching efficiency of the labour market changes.
Three phases are visible in the Barden Beveridge curve:
- 2008–2019 — the long walk back. The curve traces a textbook recovery from the financial crisis trough (14% unemployment, 0.35% vacancies in 2009Q3) back to a tight market by late 2018 (~5% unemployment, ~1.5% vacancies).
- 2020–2022 — the post-COVID surge. After the COVID dislocation, the curve jumped to its tightest position on record. Vacancies peaked at ~1.95% in 2022 Q2 with unemployment at ~4%. This was the period of explosive hiring across tech, financial services, and professional services, when counter-offers, salary inflation, and 6-week placement cycles were the norm.
- 2022–2025 — the gradual cooling. Vacancies steadily declined from the 2022 peak, while unemployment remained in the 3.5–4.3% range. The points cluster in the top-left of the chart – still a tight market by historical standards, but normalising.
- 2026 Q1 — a step away from the cluster. This is where the new quarter stands out. Rather than continuing to drift gently along the curve, the point sits notably to the right and slightly below the 2024–2025 cluster. The unemployment move (3.6% → 4.2%, a 60bps jump in one quarter) is the largest single-quarter rise we’ve seen outside of the COVID period. Vacancies also stepped down from 1.04% to 1.01%, continuing a four-quarter decline.
Reading the Move
A few things are worth being precise about.
The headline CSO number is higher. The official Q1 2026 Labour Force Survey put unemployment at 4.9%, with employment down 0.6% over the quarter. The Barden curve uses 4.2% because we filter out the public sector and related entities to focus on the private/professional market we recruit into. The gap is informative; it suggests the softening is broader than just our segment.
The sectoral story matters. The CSO release flagged that the Information & Communication sector lost 20,300 roles in Q1 2026, a 10.7% drop, driven mainly by a 16,200 fall in computer programming and consultancy. That single sectoral move is having a big impact on the unemployment numbers. Pharma, medtech and financial services aren’t showing the same pattern, and construction employment is actually up 11.7% over the year. This indicates that the market isn’t softening uniformly; it’s softening in tech-adjacent professional roles specifically.
Volatility is genuinely at play. Bank of Ireland and others have noted that the LFS data this quarter looks noisy: full-time employment is up 1.5% YoY while part-time fell 5%, and the CSO’s payroll-based measure shows employees up 2.5% YoY. Q1 income tax receipts are up 6.1% to €8.7bn – not the kind of figure you’d expect alongside a genuine employment collapse. So the right reading is that something is moving, but the magnitude on the Labour Force Survey may be overstated.
That said, the Purchasing Manager’s Index (PMI) do echo some softness. The AIB Services PMI fell to a 7-month low of 50.7 in March 2026, with services employment falling marginally for only the third time in five years. Manufacturing PMI is still in expansion. So the broader picture is one of cooling rather than contraction, but the cooling is real, and it’s showing up in services.
What it Means Commercially
For the private/professional market we operate in, the practical implications are:
- The talent-led market is fading. For most of 2022–24, well-credentialled professionals in finance, tax, legal and analytics had multiple offers and significant leverage. The decline in vacancies (now a sub-1.05% trend) suggests that leverage is declining. Counter-offer rates and offer-acceptance dynamics will follow.
- Tech is the leading edge and is leading down. The Information & Communication contraction in Q1 is the same signal we saw first in 2008. When professional hiring softens, tech tends to move first because it’s the most discretionary and the most multinational-driven. Watch this segment closely; what happens here usually precedes the rest of the professional market by a quarter or two.
- Wage pressure should ease (but slowly). Historically, vacancy rates above ~1.2% coincide with strong wage growth. We’re now at ~1.01% and trending down. Newly-qualified professional salary inflation should cool first, with mid-level moves to follow. Top-of-market (experienced hires in scarce specialisms – tax directors, FP&A leads, in-house counsel) will likely remain tight.
- The Beveridge shift hasn’t happened. The curve has moved down and to the right along the cycle, but it hasn’t shifted outward (which would mean a structural mismatch – high vacancies and high unemployment). That’s a positive read: the market is loosening, not breaking. Matching efficiency looks intact.
What to Watch for in Q2 2026
- Whether the unemployment move sticks. A revised or revisited 4.2% (rather than a further rise) would suggest Q1 was a volatility blip on a softening trend, not the start of something sharper.
- Vacancy rate movement. A drop below 0.9% would be the first move into clearly “loose” territory by post-2018 standards.
- Sector spread. Whether the Information & Communication weakness pulls in adjacent sectors (consulting, financial services tech, fintech) or stays contained.
- NQ flow this autumn. With trainee accountants and solicitors qualifying in September, watch whether the destination mix shifts — fewer industry moves, more retention in practice, would be a real-time signal of a tighter hiring environment in industry.
Source: Barden quarterly Beveridge curve, private/professional sector (excludes public sector and related entities). Cross-referenced with CSO Labour Force Survey Q1 2026 (released 21 May 2026), AIB / S&P Global Ireland PMI releases, and commentary from Bank of Ireland and Deloitte Ireland.
If you have a request and would like real-time information to inform your hiring decisions, contact Ed Heffernan at ed.heffernan@barden.ie or Elaine Brady at elaine.brady@barden.ie